You run the survey, the dashboard returns a number, and then you sit there wondering what it actually means. Your employee net promoter score is +14. Is that good news, a quiet problem, or a reason to start booking skip-level meetings?
Most eNPS guides hand you a generic benchmark and send you on your way. The trouble is that a +14 means something very different at a 90-person company than it does at a 4,000-person one, and almost nobody tells you which reading applies to you.
This guide closes that gap. You will get the definition, the formula, the score scale, real 2026 benchmarks split by industry and company size, and a practical way to move the number that isn’t just chasing it.
TL;DR
Employee net promoter score (eNPS) measures how likely your employees are to recommend your company as a place to work, on a single scale from -100 to +100. The formula is % Promoters (scored 9-10) minus % Detractors (scored 0-6). Passives (7-8) sit in the total but stay out of the subtraction. Above 0 is acceptable, 10 to 30 is good, 30 to 50 is strong, and 50+ is world-class. Anything below 0 needs attention. Benchmarks fall as headcount grows. Culture Amp’s January 2026 data puts small tech firms (100 to 200 people) at a median of +18, so a 100 to 300 person team should aim higher than the global median of +17. eNPS tells you the what, never the why. Pair it with an open follow-up question and act on the answers, or the score drifts and people stop responding.
What is employee net promoter score (eNPS)?
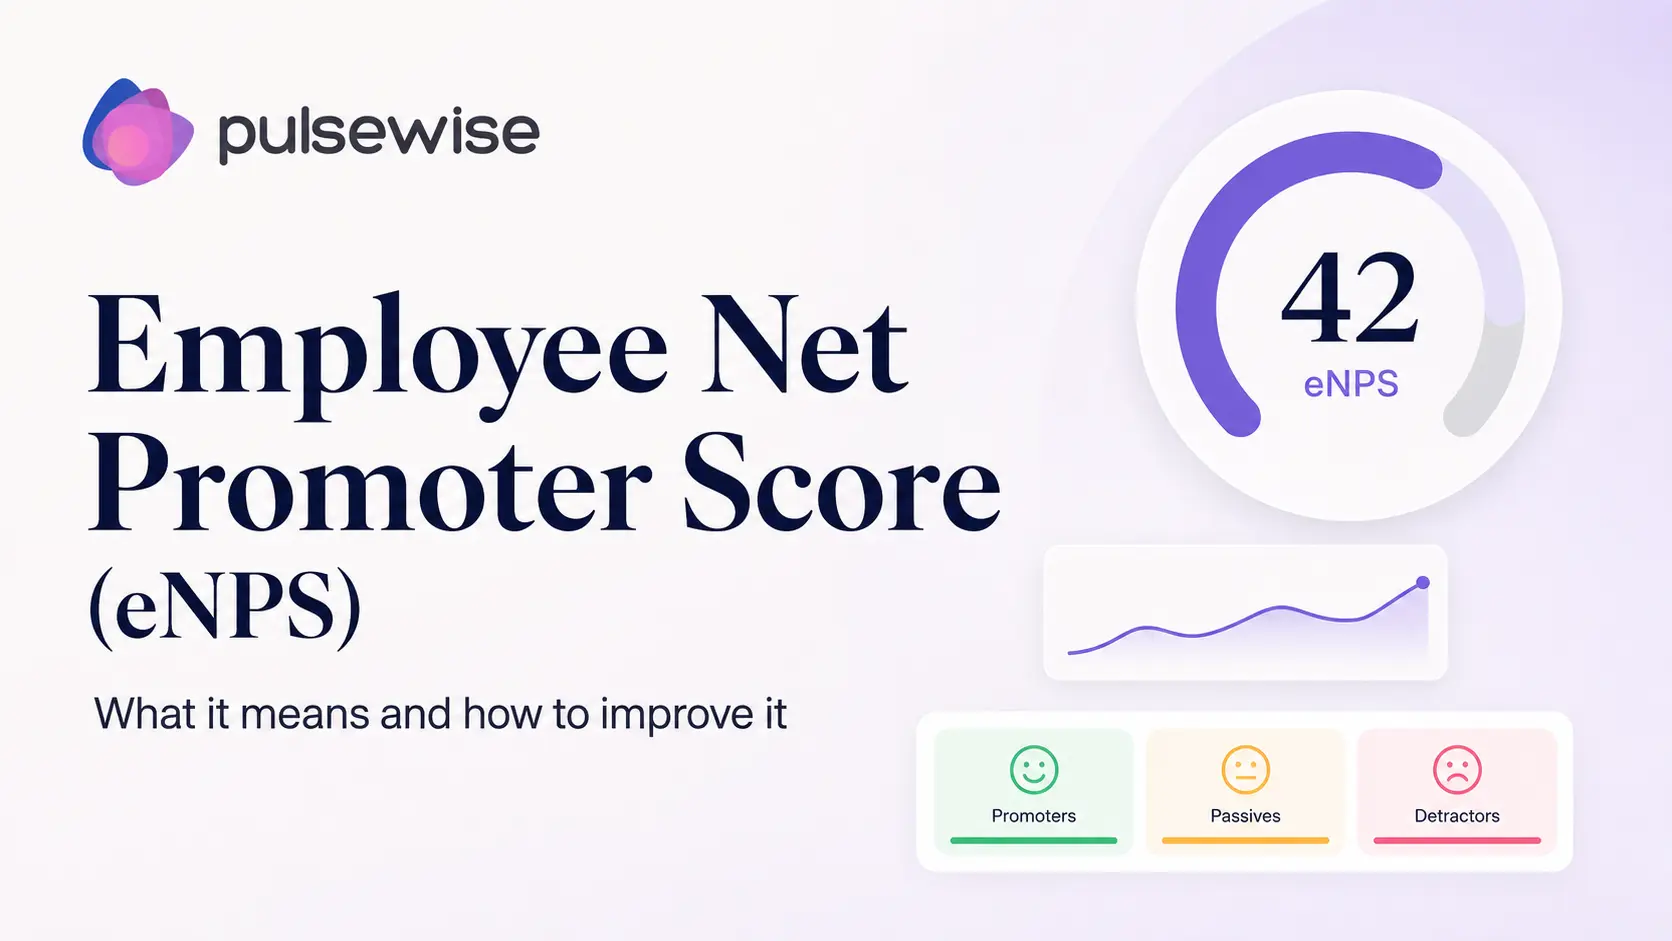
Employee net promoter score (eNPS) is a single-number metric that captures how likely your employees are to recommend your organization as a place to work. It runs on a scale from -100 to +100.
The metric adapts the customer-facing net promoter score to the workplace. Bain & Company consultant Fred Reichheld developed the original NPS and popularized it in a 2003 Harvard Business Review article, and HR teams later borrowed the same one-question logic to gauge internal sentiment.
Its appeal is speed. One question produces one number you can track over time, explain to leadership in a sentence, and benchmark quarter over quarter. It is a fast pulse on how people feel, not a full engagement survey.
The eNPS question and the 0 to 10 scale
Every eNPS program runs on one core question:
“On a scale of 0 to 10, how likely are you to recommend [Company] as a place to work?”
Responses sort employees into three groups based on the number they give:
-
Promoters (9 to 10): enthusiastic and loyal. They speak well of the company and refer strong candidates.
-
Passives (7 to 8): broadly satisfied but not enthusiastic. They stay out of the math, though they still matter.
-
Detractors (0 to 6): frustrated or disengaged. They are your clearest retention risk.
How to calculate eNPS (with a worked example)
To calculate eNPS, subtract the percentage of detractors from the percentage of promoters. Passives count toward your total respondents but drop out of the subtraction itself.
eNPS = % Promoters − % Detractors
Here is the math on a real sample. Say 200 people respond, and you get 90 promoters, 70 passives, and 40 detractors.
-
Percentage of promoters: 90 / 200 = 45%
-
Percentage of detractors: 40 / 200 = 20%
-
eNPS: 45 − 20 = +25
Two mistakes quietly wreck the number, and both are common.
-
Counting passives as promoters. Passives are neutral. They belong in the denominator, never in the promoter count.
-
Using raw counts instead of percentages. Always convert to a percentage of total respondents first, or the score breaks the moment your sample size changes.
Track eNPS without the spreadsheet Pulsewise runs the eNPS question inside pulse surveys, sorts promoters, passives, and detractors automatically, and trends the score over time so you catch a slide before it turns into a resignation. Explore Pulsewise pulse surveys
What is a good eNPS score? The full scale
A good eNPS is usually anything above 10, but the full picture depends on where you land on the scale. Here is how to read your number.
| Score | What it means |
|---|---|
| Below 0 | More detractors than promoters. Needs attention now. |
| 0 to 10 | Acceptable. More promoters than detractors, but the margin is thin. |
| 10 to 30 | Good. A healthy, positive result for most teams. |
| 30 to 50 | Strong. Clear evidence of a well-liked workplace. |
| 50 and above | World-class. Rare in any industry. |
One quirk is worth knowing. Employee eNPS tends to run lower than customer NPS, because people hold their own workplace to a higher standard than they hold a product. A +30 customer NPS is roughly average, while a +30 eNPS is genuinely good.
The most useful benchmark is your own last score. A number that climbs from +8 to +15 tells you more than a static +25 read in isolation.
eNPS benchmarks by industry (2026)
There is no universal good eNPS. The median across organizations sits around +17, but sector medians vary widely, so compare against the closest match to your world rather than the global figure.
The table below uses median eNPS scores from Culture Amp’s January 2026 benchmark dataset, which draws on tens of millions of survey responses.
| Segment | Median eNPS |
|---|---|
| All industries (global) | +17 |
| New tech (100 to 200 employees) | +18 |
| Construction and heavy industry | +17 |
| Manufacturing (1,000 to 5,000 employees) | +8 |
| Engaging growth (top-scoring group) | +40 |
Source: Culture Amp benchmark insights, January 2026. Perceptyx research puts the overall benchmark closer to +12, which is a useful reminder that medians move by provider and by year.
What is a good eNPS for a 50 to 300 person company?
For a company of 50 to 300 people, aim higher than the global median. Benchmarks fall as headcount grows, so a mid-market team that settles for the average is usually underperforming for its size.
The pattern is consistent in the data. Culture Amp’s new-tech segment at 100 to 200 employees posts a median of +18, while manufacturing at 1,000 to 5,000 employees drops to +8. In one compiled benchmark, professional services fell from +26 for companies under 100 employees to +16 for those above 1,000.
The reason is structural, not cultural. As companies grow, distance from leadership widens, feedback loops slow down, and more layers sit between the people at the top and the people doing the work.
So read your score against your size. If your 180-person team posts a +12, a generic table will call that good, but at your scale it may be a warning. Treat +20 to +30 as the real target, and treat the trend line as the scoreboard that matters.
One caution for smaller teams. Below roughly 30 respondents, two extra detractors can swing the score by double digits, so watch your response rate before you read too much into a single number.
A falling eNPS is an early exit signal When your score slides, people are often already halfway out the door. Pulsewise turns pulse trends into predicted flight risk so you can act before the resignation letter, not after it. See how Pulsewise predicts and prevents attrition
Why your eNPS can mislead you
eNPS is powerful because it is simple, and misleading for exactly the same reason. Before you present a number to leadership, know the five ways it can lie.
-
It measures brand, not just experience. A strong employer brand can float the score above the day-to-day reality of the job.
-
Small samples swing hard. Under about 30 responses, a couple of detractors can move the number by double digits.
-
It captures the what, never the why. The score alone gives you no reason and no action to take.
-
It can be gamed. Run the survey right after a bonus or an offsite and you will flatter yourself.
-
Read in isolation, it hides segment pain. A healthy company-wide +25 can bury a -10 sitting in one team or under one manager.
The fix is the same in every case. Pair the score with an open why question, and segment your results by team, tenure, and manager so the averages stop hiding the story.
How to improve your eNPS
You improve eNPS by acting on the drivers behind the score, not by chasing the number itself. Start by matching your current band to a first move.
| Your score | What it signals | First move |
|---|---|---|
| Below 0 | More detractors than promoters | Run listening sessions now and name the top two detractor themes. |
| 0 to 10 | Fragile positive | Segment by team and manager, then fix the worst pocket first. |
| 10 to 30 | Healthy, room to grow | Double down on recognition and the quality of manager 1:1s. |
| 30 and above | Strong | Protect it. Watch for complacency and drift in specific segments. |
Whatever your band, the same levers move the score over time.
-
Close the loop. The fastest way to kill eNPS is to survey and then go silent. Show people what changed because they spoke up.
-
Raise manager quality. The interaction between a manager and their team is the single biggest engagement lever, ahead of perks or pay. Invest in coaching and consistent 1:1s.
-
Make recognition frequent and specific. Regular, genuine recognition reliably produces more promoters. Vague annual praise does not.
-
Give people a growth path. Stagnation creates detractors faster than almost anything else. Clear development beats another gift card.
-
Be honest about pay. Competitive pay rarely creates promoters, but below-market pay reliably creates detractors.
-
Survey at the right cadence. Quarterly suits most teams. Run it more than monthly, and response rates fall as fatigue sets in.
For a deeper playbook, see our guide to strategies that improve employee engagement, and the wider employee engagement master guide. eNPS also sits alongside the other employee performance metrics worth tracking.
The bottom line
Go back to that +14 from the start. The number was never really the point. The point is the cycle it sets in motion: measure, read it against your size, find the why, act, and measure again.
Used well, eNPS gives you an early, honest signal that something is shifting in how your people feel. Used as a vanity score, it just decorates a slide. The difference is entirely in what you do after the survey closes.
If you would rather spend that energy acting on the score than assembling it by hand, that is exactly the gap Pulsewise fills.
Start measuring, and acting on, eNPS for free Pulsewise is free forever for the first 100 teams, with up to 100 users and no credit card required. Run your first eNPS pulse in minutes and watch the trend, not just the number. Start for free Or schedule a demo
FAQs
What is a good eNPS score?
Any eNPS above 0 is acceptable, since it means you have more promoters than detractors. Scores of 10 to 30 are good, 30 to 50 are strong, and anything above 50 is world-class. Context matters, so compare your number against your industry and your company size, not a single global figure.
How do you calculate employee net promoter score?
Ask employees how likely they are to recommend your company on a 0 to 10 scale. Label 9 to 10 as promoters, 7 to 8 as passives, and 0 to 6 as detractors. Then subtract the percentage of detractors from the percentage of promoters. Passives count in the total but stay out of the subtraction.
What is the difference between eNPS and NPS?
NPS measures customer loyalty by asking how likely someone is to recommend a product or company to a friend. eNPS applies the same 0 to 10 logic to employees, asking how likely they are to recommend the company as a place to work. Employee scores usually run lower, because people judge their own workplace more strictly.
What is the average eNPS score?
The median eNPS across organizations sits around +17 in Culture Amp’s January 2026 benchmark data, while Perceptyx research points closer to +12. Both are reference points rather than targets. Averages shift by provider, by year, by country, and especially by industry and company size, so benchmark against the closest match to your own context.
How often should you run an eNPS survey?
Quarterly is the most common and generally the healthiest cadence. It is frequent enough to catch trends and act on them, but spaced enough to avoid survey fatigue. Some teams embed the eNPS question in monthly pulse surveys. Running it more often than monthly tends to drag response rates down.
Can eNPS be negative?
Yes. Because you subtract the percentage of detractors from the percentage of promoters, the score can fall anywhere from -100 to +100. A negative eNPS means detractors outnumber promoters, which signals real dissatisfaction. It calls for listening sessions and root-cause work rather than a quick messaging fix.